Chief PaPa Official Website

[Beginner Investment Guide 2026] How Can Beginners Master Stock Entry Timing? Learn to Identify Key Buying and Selling Opportunities

🌐 English
新手投資-股票進場時機-投資教學

Many beginner investors often feel confused: they clearly selected stocks like NVIDIA or other leading AI tech giants, yet their returns still fall short of expectations — sometimes even ending in losses. In reality, “picking the right stock” is only half of the equation in successful investing. For stock market beginners, poor performance is often not due to stock selection itself, but rather the inability to identify high-probability entry points.

When investors experiment with different schools of investing — whether fundamental analysis, value investing, growth investing, or momentum strategies — and still lose money, the core issue usually lies in the absence of a systematic trading framework. Without a structured buy-sell logic, decisions become reactive and inconsistent.

This article starts from the basics of investing and integrates professional beginner investment education to guide you in using technical analysis to avoid emotional chasing at market highs (FOMO buying), and instead efficiently capture high-probability profit entry setups with better risk-reward ratios.

Why Is “Market Entry Timing” More Important Than Stock Selection?

For beginner stock investors, investing is like “sailing a sailboat” — you can only travel far with favorable winds. In the stock market, the broader market environment is like the “wind direction,” while individual stocks are your “sailboat.” If you want to sail both fast and steadily, determining the wind direction (market entry timing) is far more important than choosing the boat itself. Below are the key points for beginners on how to determine stock entry timing:

新手投資-股票進場時機-股票入門
    • Market Cycle Comes First: Determining the “wind direction” (overall market trend) is always the first step. When facing “headwinds” (weak macro environment or deteriorating market breadth), even the strongest stocks struggle to outperform.
    • Avoid Emotional Trading: Don’t set sail on the eve of a “storm.” A common mistake beginners make is entering the market during distribution days under hype-driven momentum (buying into strength at extended levels), yet failing to act on legitimate entry signals due to fear when true setups emerge.
  •  
    • Trade With the Trend: In favorable tailwind conditions, investors should focus on the strongest momentum stocks. Develop the mindset of “buy strength, not weakness” — this is the core principle of Momentum Trading.

Essential Tools for Beginners to Determine Stock Entry Timing

To capture more optimal entry and exit points in the market — and avoid the frustrating “buy-and-immediately-drop” scenario — beginner investors must learn to interpret the following three essential technical analysis indicators to identify reliable stock entry signals.

Stock Entry Timing Tool: 1. Moving Average (MA)

股票進場時機-移動平均線-技術分析
    • 50-day Moving Average (Intermediate-Term Trend): Used to identify intermediate-term support or resistance levels. When a momentum stock pulls back to the 50-day MA without breaking below it, it often presents a potential add-on or entry opportunity worth monitoring.
    • 200-day Moving Average (Long-Term Trend): Serves as a key indicator for long-term trend direction and major support levels. Investors typically look for opportunities in stocks trading above the 200-day MA, as this signals an established long-term uptrend.
  •  
    • Entry Signal: When the 50-day MA crosses above the 200-day MA — commonly known as a “Golden Cross” — and the 200-day MA begins to flatten or slope upward, it indicates a transition from a weak to a strengthening long-term trend. This is often considered a favorable long-term entry zone for investors.

Stock Entry Timing Tool: 2. Volume

股票進場時機-成交量-技術分析

“Volume doesn’t lie.” Price movements can sometimes be misleading, but volume reflects the actual flow of capital — real money in and out — and helps reveal the true intentions of institutional investors (smart money).

  • Volume Surge (Institutional Accumulation): When price breaks above a key level accompanied by a surge in volume, it suggests institutional accumulation. The breakout tends to carry higher validity and reliability due to strong participation.

  • Rising Price, Declining Volume (Weak Momentum): If a stock makes new highs while volume contracts, this is a classic case of price-volume divergence. It signals weakening buying momentum and raises the risk of a false breakout followed by a potential reversal.

  • Increasing Volume, Falling Price (Distribution Pressure): This is the most dangerous signal. If price declines on expanding volume, it indicates institutional distribution and heavy selling pressure. Entering positions under such conditions is generally high risk and not advisable.

Stock Entry Timing Tool: 3. Pivot Point

股票進場時機-樞紐點-技術分析

A pivot point is not just a random price level. It represents the most significant resistance level formed after a period of price consolidation. When a stock breaks above the pivot point with strong volume confirmation, it is considered a powerful buy signal that can effectively improve trade probability and overall win rate.

Rich Cheung’s “Rich Technical Analysis” Entry Logic

Rich贏勢技術課程-股票進場時機-投資課程推薦

Rich Cheung, mentor of the Chief PaPa team, emphasizes that “market cycles take priority over individual stock selection.” Determining the overall market direction is always the first step, while stock picking comes second. Below are three foundational stock analysis methods that beginner investors should focus on, integrated with Rich’s core investment teaching framework:

Beginner Stock Analysis Method: 1. VCP Pattern (Volatility Contraction Pattern)

股票進場時機-樞紐點-技術分析

The Volatility Contraction Pattern (VCP) reflects the dynamics of market supply and demand. By observing price movements narrowing from wide fluctuations to progressively tighter contractions — with more contractions indicating stronger accumulation and tighter share ownership — investors can anticipate the moment when selling pressure is absorbed and a potential breakout is imminent.

When a stock reaches the right side of a VCP structure, accompanied by extremely low volume, and then suddenly breaks above the pivot point on a surge in volume, it is considered a low-risk entry point. This pattern helps beginner investors identify potential breakout buy opportunities or determine key support levels during pullbacks.

Beginner Stock Analysis Method: 2. Market Breadth Analysis

股票進場時機-市寬-技術分析

Rich applies market breadth far beyond what typical analysts do — he treats it as a core indicator for distinguishing real strength from false strength in the market. Market breadth measures how many stocks are participating in an advance. If an index makes new highs but the number of advancing stocks fails to do the same, beginner investors should remain cautious.

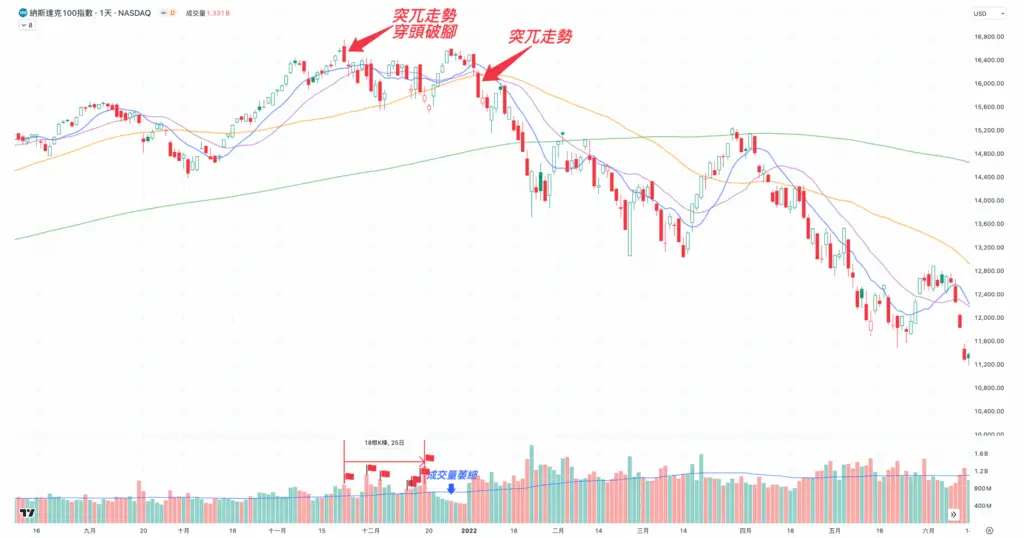
Market Breadth Divergence (Major Risk Warning): If a major index (such as the S&P 500) reaches new highs while the number of participating stocks declines, this is known as a “breadth divergence.” It signals that only a small group of heavyweight stocks is propping up the index, while the majority of stocks are already lagging.

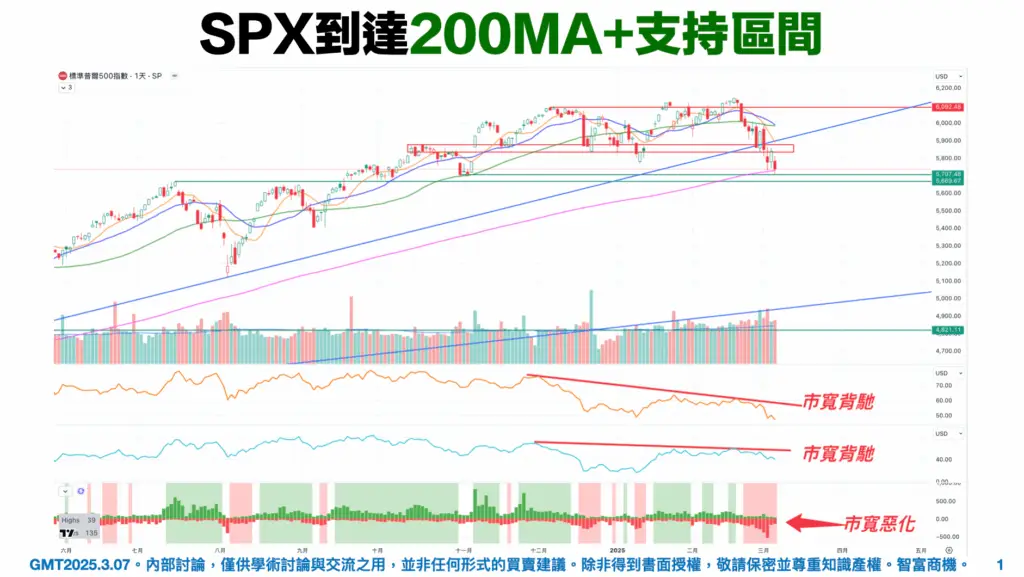
Case Study: Prior to the 2025 tariff-war selloff, Rich used breadth divergence to anticipate the market downturn, helping his students avoid the sharp decline.

  • Index Continues Making New Highs: At the time, the S&P 500 maintained an upward trend. On the surface, market sentiment appeared optimistic.

  • Breadth Trending Lower: In contrast, key breadth indicators such as the percentage of stocks above their 50-day moving average and 200-day moving average were gradually declining.

  • “Index Up, Breadth Down” Phenomenon: Although the index was printing new highs, the proportion of stocks trading above their 50-day and 200-day moving averages was shrinking. This showed that market leadership was narrowing and the underlying structure was weakening.

Therefore, when beginner investors observe a bearish breadth divergence at market highs, they must increase vigilance, as it often serves as an early warning sign that the broader market may be approaching a potential top.

Beginner Stock Analysis Method: 3. Identifying “Distribution Days” to Avoid Risk

股票進場時機-市寬-技術分析

Rich emphasizes that “volume doesn’t lie,” and identifying a Distribution Day is a crucial part of understanding institutional liquidation behavior.

Rich’s definition of a Distribution Day is a trading session where price declines on significantly higher volume. If more than four distribution days occur within a four- to five-week period, it signals a high probability that the broader market is approaching a top. At that stage, investors should reduce exposure or pause new entries, rather than look for fresh buying opportunities.

Case Study: The 2021 Nasdaq Top (Proven Effective Tool)

  • Index Peak: In late 2021, the Nasdaq reached its peak. Market sentiment was extremely bullish, with widespread expectations of a prolonged bull market.

  • Clustered Distribution Signals: In just 18 trading days before the index printed new highs, there were seven distribution days recorded.

  • Large-Scale Institutional Exit: It was like a ship with seven major holes in its hull. While novice investors were still celebrating on deck, the risk of sinking had already risen dramatically.

By learning to identify distribution days, students avoid being misled by superficial price strength. Instead, they can exit defensively before major downside risk materializes — mastering a critical investment mindset in the process.

Mastering Stock Entry Timing | “Keys to Rich Technical Analysis”

技術分析-Rich贏勢技術課程-投資課程推薦

To achieve consistent profitability in the stock market, relying on scattered indicators alone is not enough. Beginner investors need a complete entry-level investing system — from assessing overall market direction, selecting leading stocks, executing strategic entries, to enforcing strict stop-loss discipline.

Rich Cheung specializes in simplifying complex technical analysis into clear, easy-to-follow SOPs (Standard Operating Procedures) that even a 10-year-old can understand. This investment course will teach you to develop a “win in both directions” mindset: true winners not only profit in rising markets, but also know how to protect themselves during downturns.

If you want to break free from the vicious cycle of blind stock picking and impulsive buying, join Rich’s limited-time 60-minute “Keys to Rich Technical Analysis” and build the core foundation of a profitable trading system.

Register now for the free “Keys to Rich Technical Analysis” and elevate your beginner investing skills!

Scroll to Top